MRI scanner measures the beating of the brain

Researchers at UMC Utrecht have taught the MRI scanner a new trick. With it, the device can map how the brain pulses slightly under the influence of the heartbeat. The beating of the brain is a fascinating phenomenon that we currently know very little about. It probably plays an important role in flushing out toxic waste, and thus in preventing brain diseases such as Alzheimer's disease. On October 26, Jacob-Jan Sloots will obtain his doctorate on this subject at UMC Utrecht.
With every heartbeat, blood flows to the microscopically small capillaries in the brain. This causes brain tissue to temporarily swell a tiny bit, making the brain appear to beat just like the heart. This phenomenon is known to exist, but until now it has hardly been studied. "In studies of brain activity, the heartbeat is actually filtered out of the data by default, because it is considered noise," says researcher Jaco Zwanenburg of UMC Utrecht Brain Center. He himself, having been trained as a physicist, sees it differently. "Mechanics play an important role in many biological processes. The stiffness and structure of the substrate on which stem cells grow, for example, determines what kind of cells they develop into."

Jacob-Jan Sloots en Jaco Zwanenburg
Measuring rhythmically
The beating of the brain also has a function, Zwanenburg thinks. Perhaps even several functions. It is obvious, for example, that the phenomenon is important for the clearance of waste products. These mix with the cerebrospinal fluid, which is then discharged. "The pulsation of the brain is like dipping a tea bag into hot water. Without this dipping, the tea would also mix with the water eventually, but the movement speeds up the process considerably." Since efficient waste removal is essential for a healthy brain, and since waste accumulation is linked to brain disease, a good understanding of how this process works is important. But until now, there was no good method for mapping brain tissue deformation.
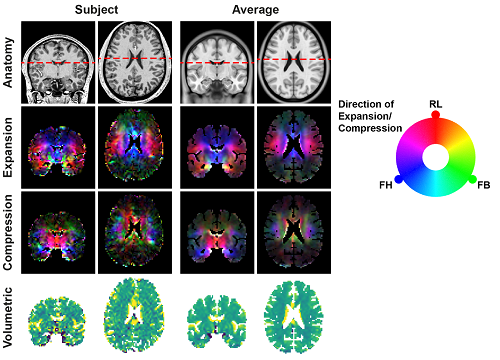
MRI scanners can detect the tiny movements of brain tissue that are not visible to the naked eye. Except that standard brain scans are not built to measure at the rate of a human heartbeat. Jacob-Jan Sloots, who did his PhD research in Zwanenburg's group, solved that problem. He developed sophisticated software that enables sensitive MRI scanners to measure the distortion of the brain, influenced by the heartbeat, over time. He then validated the new MRI software with human test subjects. "Our tests showed that the brain deforms like a rubber band that you pull out," Sloots explains. "The tissue expands in one direction, while it contracts a bit in the direction perpendicular to that. This is a well-known physical phenomenon and is called the Poisson effect. We did not yet know that it also occurs in the brain."
Better understanding
By expanding the capabilities of MRI, researchers can now look at tissue deformation in the brain in a new, non-invasive way. "In effect, we have built a completely new platform for brain research," Zwanenburg said. "We hope that this technique will lead to new insights into the processes that take place in the brain, and a better understanding of the origins of brain diseases such as Alzheimer's disease." In the meantime, the researchers want to further refine their software as well as work on methods to be able to extract information about the brain tissue from these measurements, such as the stiffness of the tissue. Jaco Zwanenburg recently received a Vici grant of 1.5 million euros, which will enable his group to continue working on this challenge in the years to come.

Caption:
This image shows the deformation of brain tissue in healthy volunteers. The first two columns of images represent one individual subject. The third and fourth columns of images show the average result across 9 volunteers, making the images look smoother (with less noise). The first row shows the anatomy of the brain for reference. The second and third rows show tissue expansion and concurrent tissue compression. Here the intensity indicates the magnitude of the expansion/compression and the colors show the direction: red is right-left (RL), green front-back (FB) and blue is the direction feet-head (FH). The net increase (yellow) or decrease (blue) in tissue volume is shown in the bottom row. The images of tissue expansion (second row) nicely show how the tissue in healthy individuals stretches toward the center of the brain.
