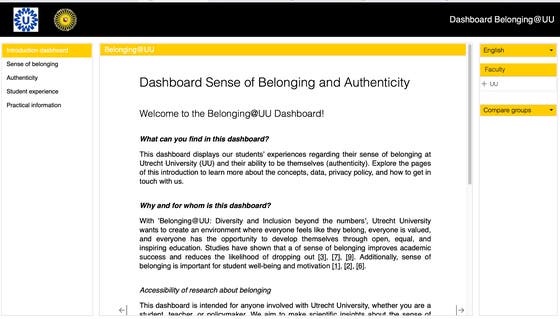
Belonging@UU Student Survey: Launch and demonstration of a new dashboard

On October 26, during Diversity Month, the Belonging@UU project team launched the brand-new Belonging@UU dashboard for student surveys. This dashboard reflects students' experiences regarding their sense of belonging at Utrecht University (UU) and their ability to be themselves. It marks a significant milestone in promoting diversity and inclusion at Utrecht University and UMC Utrecht.
The launch, held at the Administration Building on Utrecht Science Park, brought together employees with diverse backgrounds and roles, aligning with the dashboard's aim to reach a broad audience. Project leader Gönül Dilaver explained: "We are writing a scientific paper about it, but not everyone reads that. That's why we wanted to create something that is accessible to everyone and initiates discussions about the sense of belonging at all levels of the university.
Why Research and a Dashboard?
Research indicates that a sense of belonging promotes academic success and reduces dropout rates. Additionally, a sense of belonging is crucial for students' well-being and motivation. Hence, for the Belonging@UU project, a survey was conducted among all students, with over 4,000 students completing the questionnaire to gain insights into their sense of belonging and the extent to which they can be their authentic selves. This research revealed that students with disabilities, students with religious beliefs, and bachelor students from ethnic minority backgrounds tend to experience a lower sense of belonging.
Fostering a Sense of Belonging
The dashboard illustrates differences in the sense of belonging among various student groups. It serves as a support tool for students, teachers, and policymakers to collaborate on creating an educational environment where everyone feels at home and can be their authentic selves. For example, by examining and comparing students' feelings of being at home within the dashboard among different student groups, this can serve as a starting point for initiatives to enhance this sense of belonging. Policymakers and administrators can also use the dashboard's results to prioritize and track progress regarding the sense of belonging. The dashboard is available in both Dutch and English and can be accessed via this link.
